exporter开发(上篇)


exporter开发(上篇)

上篇文章剖析了node_exporter源码,接下来就要自己实践下exporter的开发了。

1,一个”hello world”demo版的exporter

正式开启exporter开发之前,我们先来个exporter开发的hello world

1
2
3
4
5
6
7
8
9
10
11
12
13
14
15
16
package main

import (
"fmt"
"net/http"
)


func HelloWorldHandler(w http.ResponseWriter, r *http.Request) {
fmt.Fprintf(w, `metric_name{label_name="label_value"} 80` )
}

func main () {
http.HandleFunc("/metrics", HelloWorldHandler)
http.ListenAndServe(":8080", nil)
}

启动起来之后,我们把它加入到prometheus的配置文件里:

1
2
3
4
5
6
7
8
scrape_configs:
# The job name is added as a label `job=<job_name>` to any timeseries scraped from this config.
# metrics_path defaults to '/metrics'
# scheme defaults to 'http'.
- job_name: 'hello_world'
static_configs:
- targets:
- localhost:8080

然后把它和prometheus都启动起来,我们看一下prometheus的采集结果:
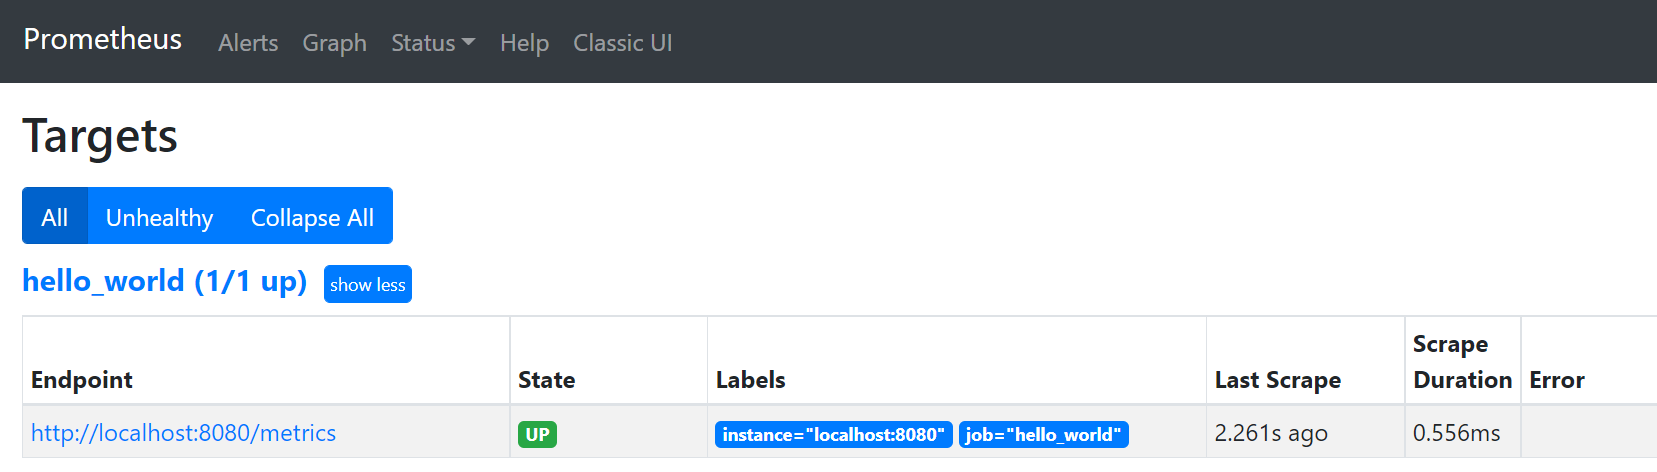
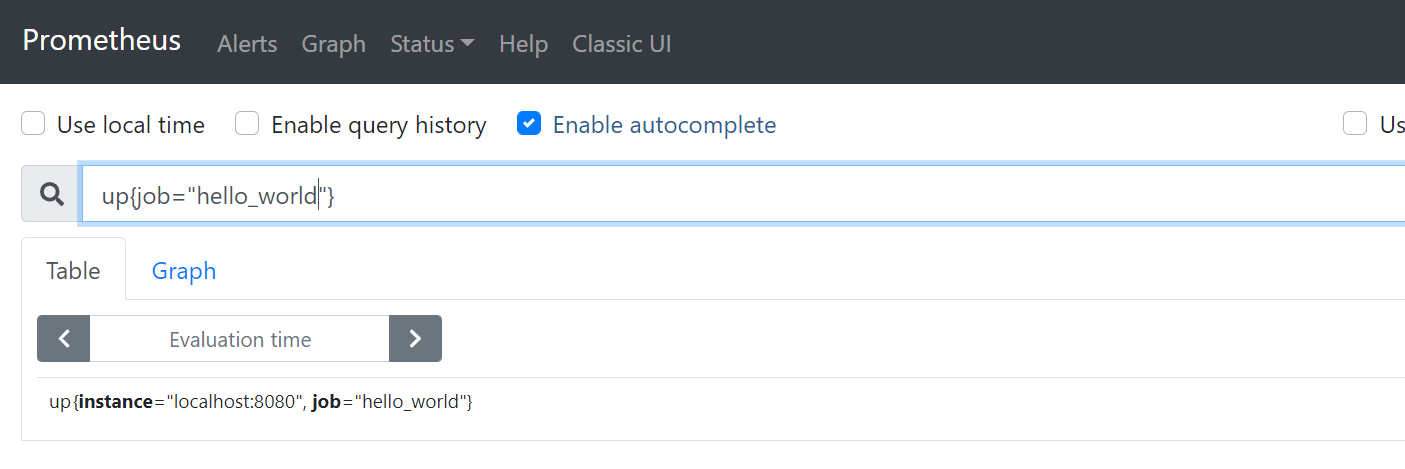
到此,我们已经完成了一个简易版的自研exporterDemo

2,开发exporter需要遵循的规范

作为一个优秀的开源监控项目,Prometheus的可扩展性是非常强大的,所以才出现了各种强大的中间相关exporter。但是,无规矩不成方圆,
要接入Prometheus就要遵循它的规范,了解了这些之后,你的exporter开发之路将会非常顺利,因为这个规范很简单,就只有一个interface:

1
2
3
4
5
6
7
8
9
10
11
12
13
14
15
16
17
18
19
20
21
22
23
24
25
26
27
28
29
30
31
32
33
34
35
36
37
38
39
40
41
42
43
44
45
46
47
48
49
50
package prometheus

// Collector is the interface implemented by anything that can be used by
// Prometheus to collect metrics. A Collector has to be registered for
// collection. See Registerer.Register.
//
// The stock metrics provided by this package (Gauge, Counter, Summary,
// Histogram, Untyped) are also Collectors (which only ever collect one metric,
// namely itself). An implementer of Collector may, however, collect multiple
// metrics in a coordinated fashion and/or create metrics on the fly. Examples
// for collectors already implemented in this library are the metric vectors
// (i.e. collection of multiple instances of the same Metric but with different
// label values) like GaugeVec or SummaryVec, and the ExpvarCollector.
type Collector interface {
// Describe sends the super-set of all possible descriptors of metrics
// collected by this Collector to the provided channel and returns once
// the last descriptor has been sent. The sent descriptors fulfill the
// consistency and uniqueness requirements described in the Desc
// documentation.
//
// It is valid if one and the same Collector sends duplicate
// descriptors. Those duplicates are simply ignored. However, two
// different Collectors must not send duplicate descriptors.
//
// Sending no descriptor at all marks the Collector as “unchecked”,
// i.e. no checks will be performed at registration time, and the
// Collector may yield any Metric it sees fit in its Collect method.
//
// This method idempotently sends the same descriptors throughout the
// lifetime of the Collector. It may be called concurrently and
// therefore must be implemented in a concurrency safe way.
//
// If a Collector encounters an error while executing this method, it
// must send an invalid descriptor (created with NewInvalidDesc) to
// signal the error to the registry.
Describe(chan<- *Desc)
// Collect is called by the Prometheus registry when collecting
// metrics. The implementation sends each collected metric via the
// provided channel and returns once the last metric has been sent. The
// descriptor of each sent metric is one of those returned by Describe
// (unless the Collector is unchecked, see above). Returned metrics that
// share the same descriptor must differ in their variable label
// values.
//
// This method may be called concurrently and must therefore be
// implemented in a concurrency safe way. Blocking occurs at the expense
// of total performance of rendering all registered metrics. Ideally,
// Collector implementations support concurrent readers.
Collect(chan<- Metric)
}

这个interface定义在client_golang中,client_golangprometheus的官方go库,
既可以用于集成现有应用,也可以作为连接Prometheus HTTP API的基础库。
Collector这个接口里的每个字段我都会给出详细的解析,在此之前,我们先了解几个和本章内容相关的基本概念,关于prometheus的详细内容,还需要读者自己去学习;

2.1 Prometheus监控系统的架构图


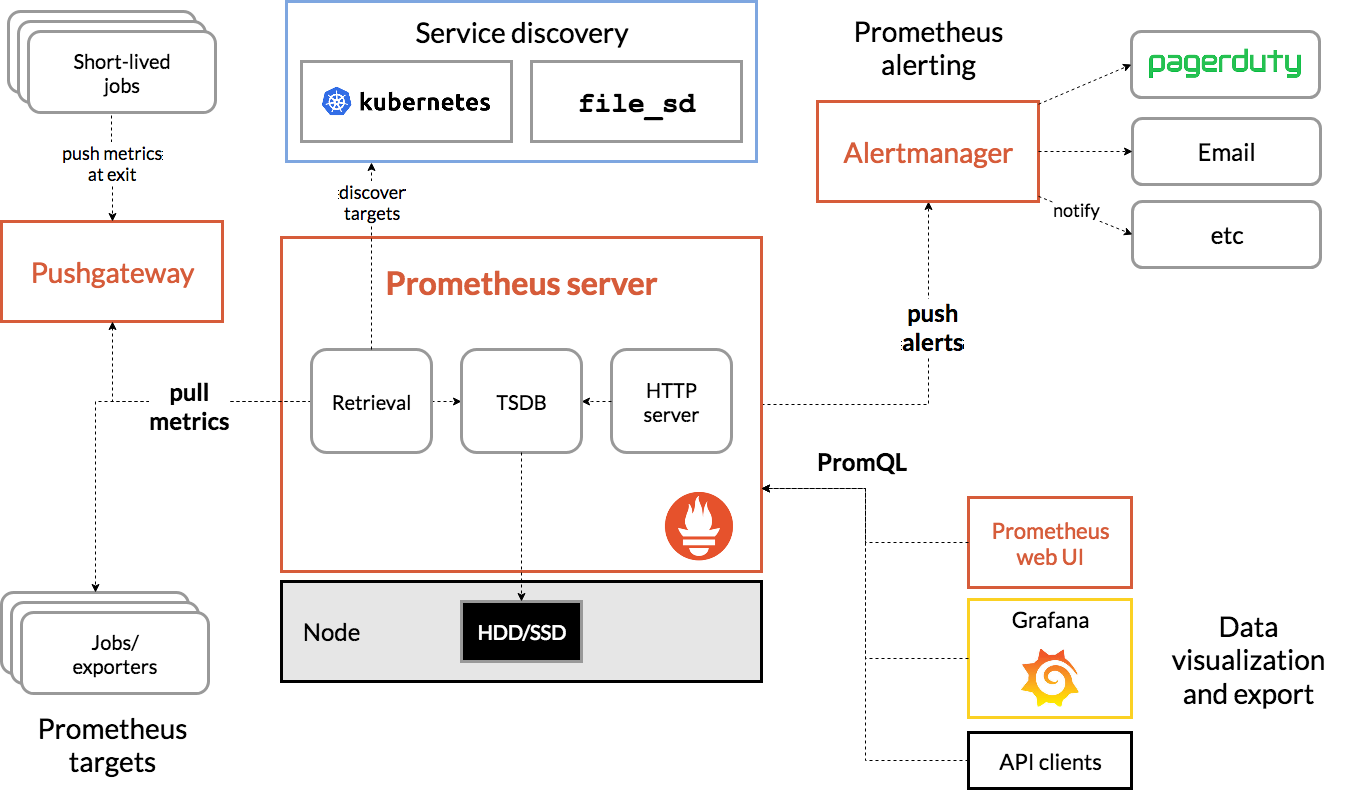
和本篇相关的就是左下角的部分,Prometheus targets也就是各种的exporter
Prometheus server从各个target上获取采集数据的方式是pull,也就是通过 http协议向各个exporter发送GET请求,默认的路径就是/metrics,所以就像上面我们的hello world版的Demo一样,遵循这种规范就可以被Prometheus server采集到。

2.2 数据结构

数据已经采集到了,但是Prometheus server怎么能正确的领会到我的意图呢?也就是说它怎么能正确解析出我的数据呢?
那就需要我们发送的数据遵循client_golang里定义的的数据结构的规范了。
Prometheus client libraries 提供了四种核心的 metric types ,我在这里简要列举一下:

metric types 概念 用途
Counter 收集的数据是按照某个趋势(增加/减少)一直变化的 服务请求总量、错误总数等
Gauge 收集的数据是一个瞬时的值,与时间没有关系,可以任意变高变低 当前 goroutines 的数量、内存使用率、磁盘使用率等
Histogram 表示一段时间范围内对数据进行采样(通常是请求持续时间或响应大小),并能够对其指定区间以及总数进行统计,通常它采集的数据展示为直方图 计算数据的分位数
Summary 和 Histogram 类似 同上

这里要讲一下HistogramSummary的区别:

  • Histogram,将时间范围内的数据划分成不同的时间段,并各自评估其样本个数及样本值之和,因而可以在server端计算出分位数;
  • Summary,直接在客户端,也就是采集端,上报计算好的分位数;

所以,重点就在于2.12.2,一个定义了怎么给,另一个定义了给什么样的数据。

3,Collector接口详解

3.1,Collector相关的重点struct关系图
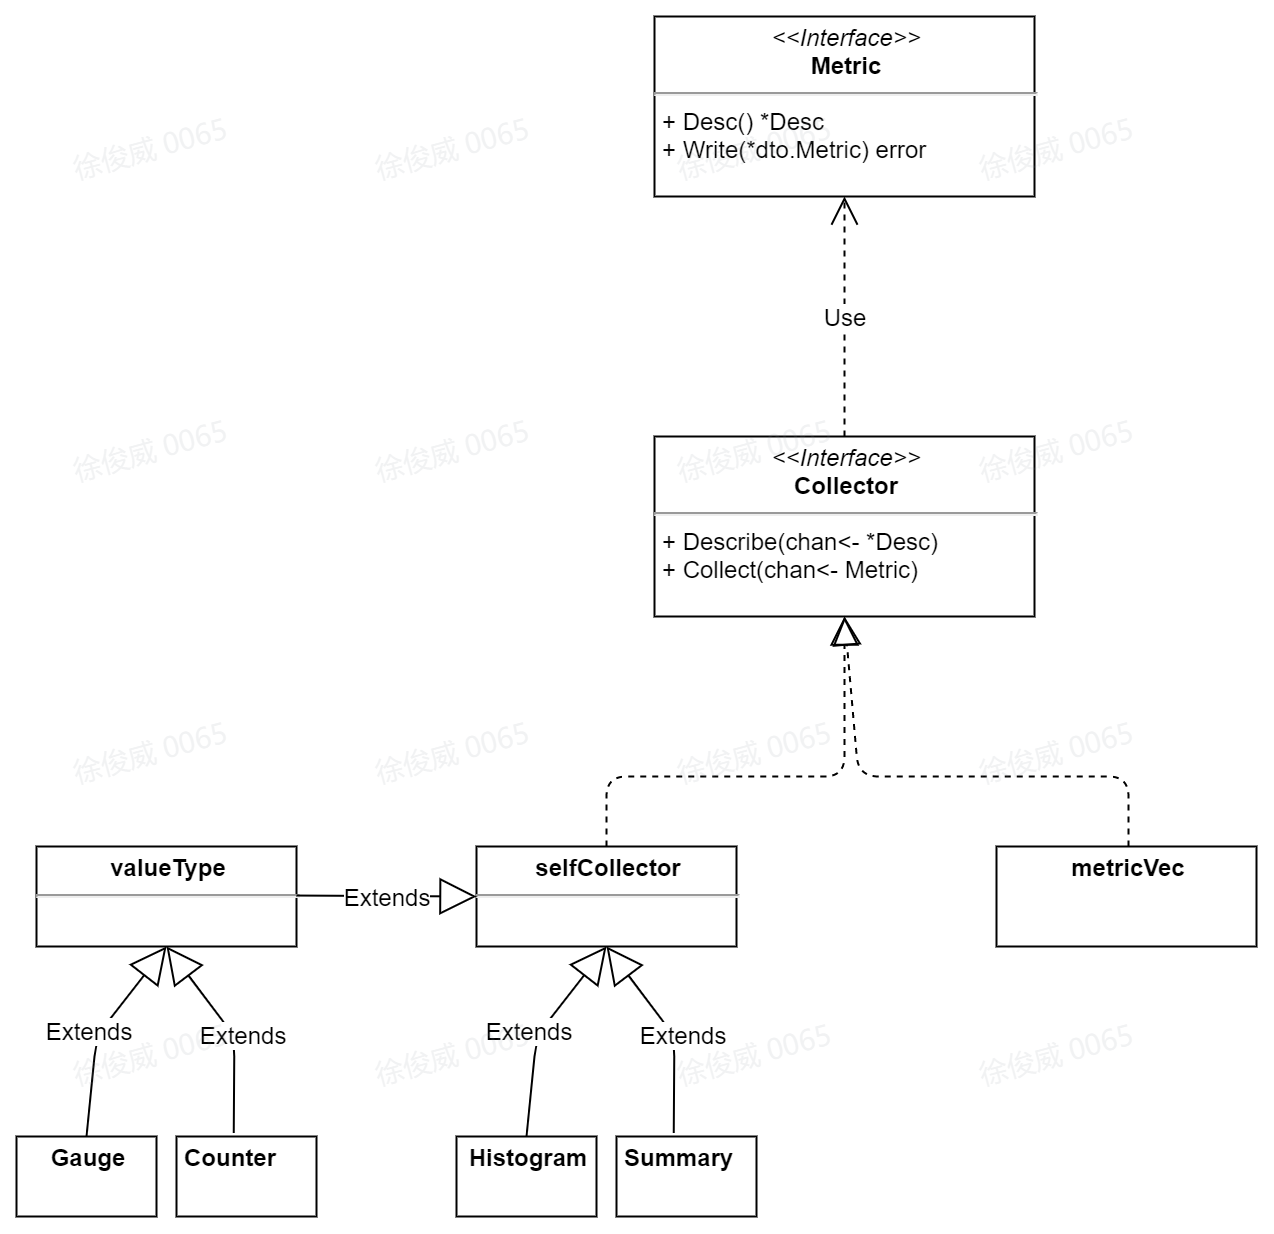
3.1.1,Metric

指标,即对单个值进行建模的结果,上面讲到的四种metric types都是它的具体实现,即包括我们自定义开发在内的所有exporter上定义的采集数据,其类型,都是Metric的具体实现;

  • 接口 Desc() *Desc : 返回关于Metric的描述符。
  • 接口 Write(*dto.Metric) error : 将Metric编码为Protocol Buffer传输对象

3.1.2,Collector

各种exporter上的主要struct都是Collector的具体实现,如node_exporter源码中的NodeCollector

  • 接口 Describe(chan<- *Desc) :传递指标描述符到 channel
  • 接口 Collect(chan<- Metric) : 执⾏抓取函数并返回数据,返回的数据传递到 channel 中

3.1.3,MetricVec

用来做为‘相同指标名,不同标签值的’Collector,比如 采集指标名为number of HTTP requests的数据,可以根据response codemethod来区分不同的标签值。MetricVec也有四种具体的实现:

  • GaugeVec
  • CounterVec
  • SummaryVec
  • HistogramVec

下一篇文章,将通过具体的exporter开发代码讲述下相关的实践。